 Acocks Green History Society
Natural increase in population in Yardley 1539 to 1839
This information was compiled by the discovering Yardley Group. It compares births with burials. The column headings are Year, Baptisms, Burials, Excess of Births, Excess of Deaths, going from left to right.
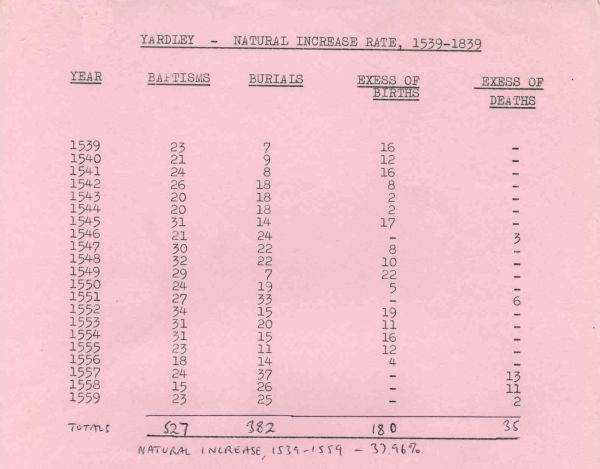
1539 to 1559. Natural increase 37.96%
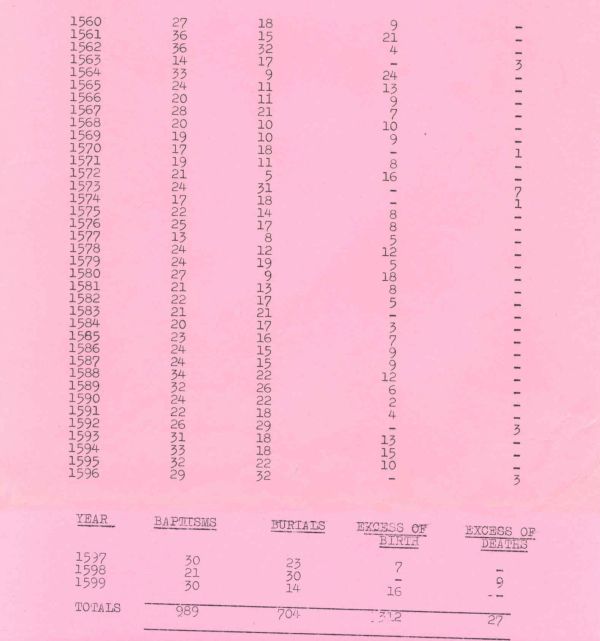
1560 to 1599. Natural increase 40.51%
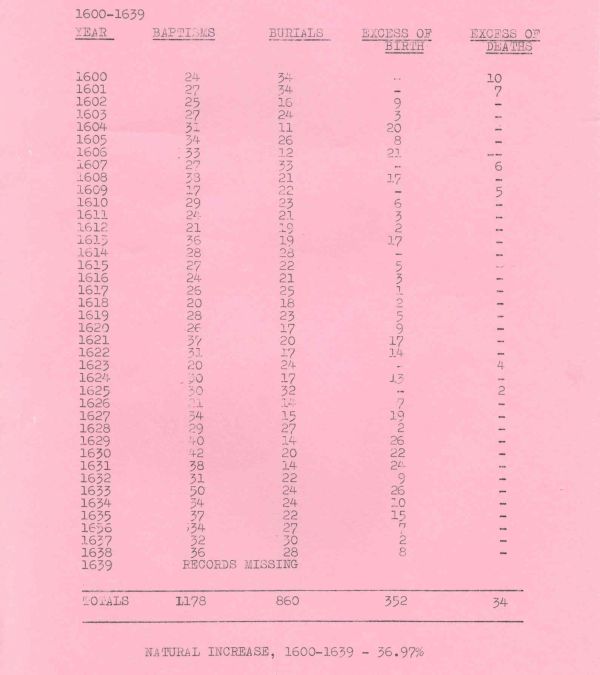
1600 to 1639. Natural increase 36.97%
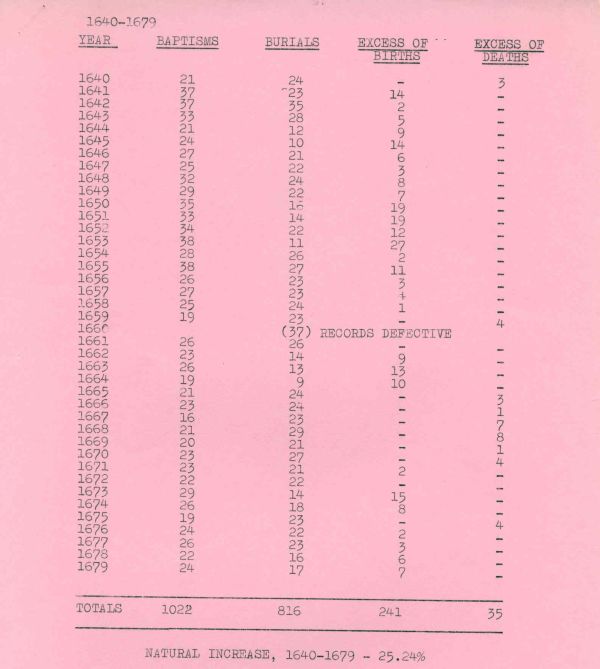
1640 to 1679. Natural increase 25.24%

1680 to 1719. Natural increase minus 4.18%
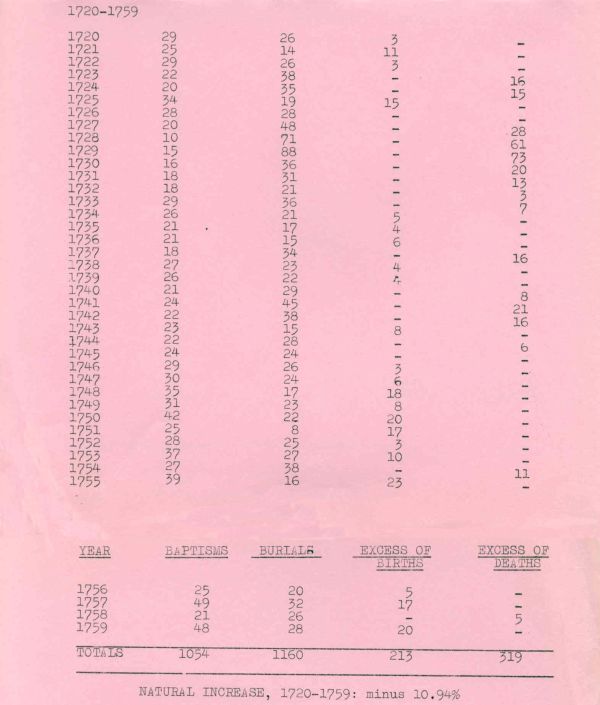
1720 to 1759. Natural increase minus 10.94%
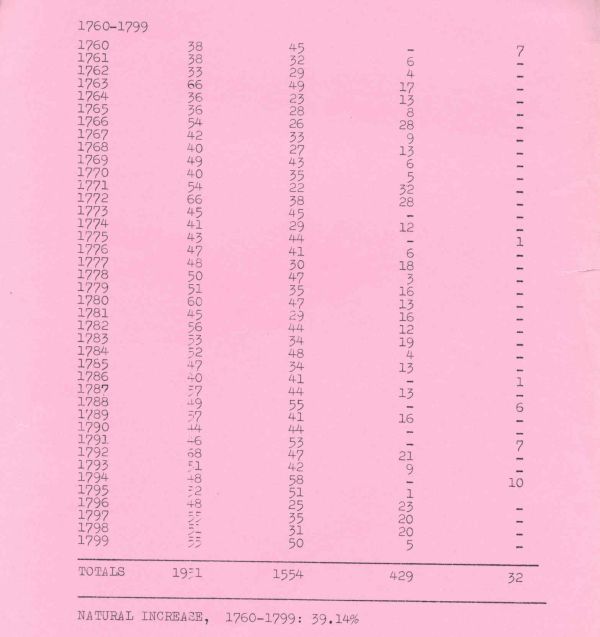
1760 to 1799. Natural increase 39.14%
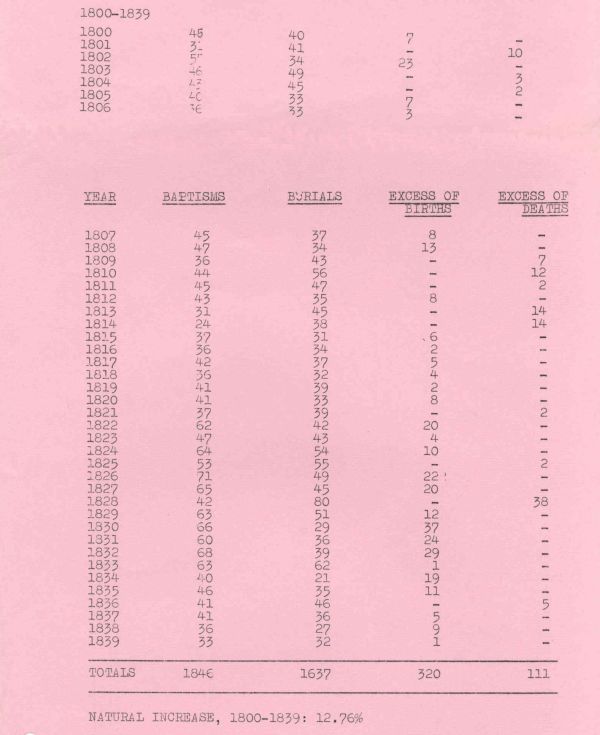
1800 to 1839. Natural increase 12.76%